The SOA Long-Term Care Population Research Model: Examining the Consumer Impacts of Long-Term Care Benefits
By Edward Armentrout
Long-Term Care News, April 2025

The Society of Actuaries (SOA) recently published the Long-Term Care Population Research Model (LTC Population Research Model), a resource that can be used to examine the potential consumer impacts of a public long-term care (LTC) benefit.[1] This Excel-based model examines the potential effects of a national, public LTC benefit on the finances and service utilization of the disabled population.[2] These effects are summarized and provided as output for user review. In addition, the model provides a high-level financing estimate, in terms of a payroll tax, to provide context to the cost of the benefits.
The LTC Population Research Model is intended to be an educational tool to aid users in better understanding the disabled population and how this population could be impacted by a public LTC benefit. The model should be used to gain a general understanding of the following:
- Demographics of the disabled population in the United States
- How those with an LTC need receive care (formal vs. informal)
- Current sources of financing for long-term care expenditures
- Relative effects of publicly available benefits on service utilization and individual finances for various cross-sections of the population
The model provides illustrative estimates and is not intended to support financial or policy decisions.
The intended users of this model include actuaries, researchers and other parties interested in understanding generalized impacts of the availability of LTC benefits at a federal level.
Data
The LTC Population Research Model utilizes a person-level dataset to simulate the impact of a public LTC benefit on beneficiary finances, current LTC payers and informal caregivers. This dataset contains demographic, financial and LTC utilization data for US episodes of disability active in 2018.
National survey data were used to generate a plausible set of LTC episodes that can be used to illustrate the potential impacts of public LTC program proposals on various beneficiary subpopulations. Producing this dataset involved a number of assumptions that were determined using actuarial judgment and currently available data.
The episode-level dataset was constructed using the following survey data from 2018:
- Medical Expenditure Panel Survey—Household Component (MEPS-HC), 2018[3]
- Medicare Current Beneficiary Survey (MCBS), 2018[4]
- Health and Retirement Study (HRS), RAND HRS Longitudinal File 2018 (V1)[5]
- National Health Interview Survey (NHIS), 2018[6]
- Survey of Income and Program Participation (SIPP), 2018[7]
Community and institutional episodes were considered separately due to limitations in linking community and facility stays. The MEPS-HC and MCBS were used as the primary data sources for the community and institutional populations, respectively, because these surveys contain annual expenditure information. Data items that were not present in the primary data sources were assigned using stratified random sampling of records from supplementary data sources. Disability status and expenditures were compared to published sources in order to validate reasonableness. Reported LTC expenditures, income and assets were then trended to 2024 dollars.
Each record contains information regarding:
- Age
- Sex
- Region
- Income/asset level
- Count of activities of daily living (ADL) for which assistance is needed
- Presence of severe cognitive impairment
- Length of episode
- Medicaid coverage
- Private LTC insurance coverage
- Informal care utilization
- LTC episode expenditures
- Medicaid
- Out-of-pocket (OOP)
- Medicare
- Private insurance
- Other[8]
It is important to note that survey data often rely on self-reporting. While the survey administrators validate expenditure amounts, when possible, the data are not as accurate as administrative payment data. Additionally, because these data are constructed at a national level, the model is not able to provide state-specific detail.
Model Calculations
User Input
Users are able to specify various parameters to define a nationwide LTC benefit. These parameters can be grouped into the following categories:
- Benefit definition
- Financing assumptions
The benefit definition assumptions are used to simulate the effects of the user-defined program on finances and LTC utilization of the disabled population. These parameters include:
- Covered benefits (community, facility, both)
- Benefit trigger criteria
- Benefit information (daily benefit amount, benefit period and maximum benefit)
- Elimination period
- Cash vs. service reimbursement
The financing assumptions are used to produce an estimate of the magnitude of payroll tax rate needed to fund the specified program. Financing assumptions that can be specified include:
- Inflation protection
- Eligibility requirement (vesting/no vesting)
- Tax base for program funding
- Expense assumption
Model Calculations
After LTC benefit program parameters are defined by the user, the LTC Population Research Model provides an illustrative estimate of the tax rate necessary to fund the benefit and adjudicates the benefit for each record in the LTC episode dataset. This process employs multiple assumptions to estimate potential high-level impacts of the selected benefits.
The model generates payroll tax estimates using a 75-year projection of benefits administered to the US population. This time frame is consistent with projections of the Social Security Trust Fund and is sufficient to cover the projected lifetime of a new workforce entrant. A projection over this time frame is highly uncertain, but it is important to develop an estimate to provide context to the benefits being modeled.
The LTC benefit is applied to each record in the LTC episode dataset to estimate effects on current LTC expenditures and utilization. Benefit payments for each individual are estimated based on length of episode and the benefit parameters selected by the user. When estimating how a benefit will interact with existing sources of LTC expenditures, the model assumes that current Medicaid and OOP expenses will be offset by the benefit and that the benefit pays secondary to all other sources. This means that Medicare, private, and other (VA, TRICARE and other programs) expenditures will be unchanged.
Current Medicaid expenditures are the first category offset by the LTC benefit. When reducing Medicaid expenditures, the model considers differences in Medicaid reimbursement for services compared to private pay and assumes that, on average, Medicaid pays 80% of private pay for the same services. This implies that $1.25 of LTC benefit reimbursement is required to reduce Medicaid expenditures by $1.
The model applies any benefit that remains after Medicaid expenditures have been reduced to OOP expenditures. If there is benefit remaining after current Medicaid and OOP expenditures have been fully funded, the model considers this amount as additional benefit. This additional benefit is assumed to be used to provide additional formal care and/or offset informal care.
Model Output
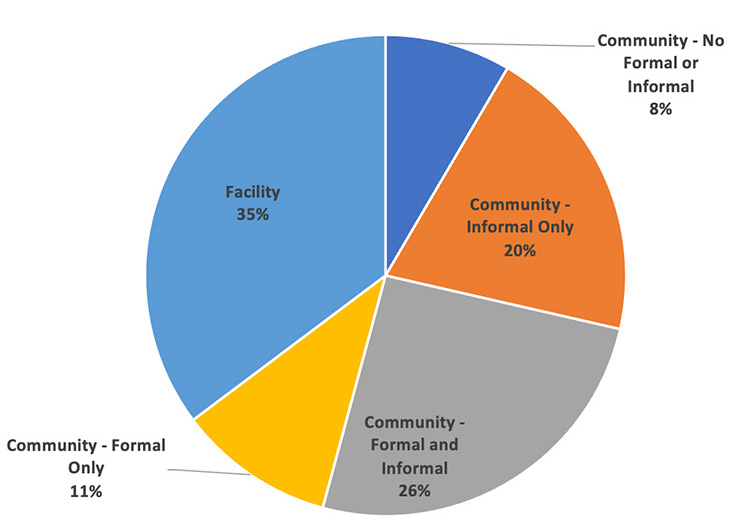
After the benefit has been applied to each of the LTC episode records, the model aggregates the record-level impacts and provides summary output. This output includes the demographics of the disabled population, current LTC utilization and average expenditures, estimates of changes to utilization and expenditures, and a high-level funding estimate. Figure 1 provides an example of output describing current LTC service utilization.
Figure 1
LTC Service Utilization by Care Setting in 2018, 2+ ADLs/Severe Cognitive Impairment
Average LTC episode expenditures are reported by channel of payment for various cross-sections of the population including:
- Age group
- Sex
- Region
- Family income group
- Net worth group
- Informal care status
- Care setting
- Medicaid eligibility
- Private LTCI coverage
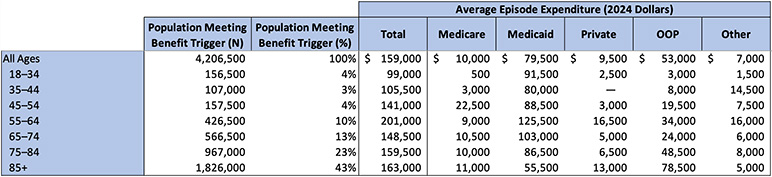
The LTC benefit and changes to current expenditures are examined in a series of output tables that compare the average benefit payment to current LTC expenditures, break down changes in OOP spending and consider additional care that can be purchased with benefit payments in excess of current Medicaid and OOP spending. Table 1 provides an example of output provided for current LTC expenditures.
Table 1
Estimated LTC Episode Expenditures, by Channel of Payment (2024 Dollars)
Episodes of Disability with 2+ ADLs/Severe Cognitive Impairment in 2018, with Reported Expenditures
Conclusion
The LTC Population Research Model can be used as a tool to better understand the composition and dynamics of the disabled population in the United States. It provides high-level estimates of current LTC utilization and expenditures and functions as a tool to examine the effects of a national, public LTC benefit. The SOA hopes the tool can be used to educate and spur discussion around the pressing issue of LTC need and financing.
Statements of fact and opinions expressed herein are those of the individual authors and are not necessarily those of the Society of Actuaries, the editors, or the respective authors’ employers.
Edward Armentrout, ASA, MAAA, is an actuary at the Actuarial Research Corporation. Edward can be reached at eja@aresearch.com.
Endnotes
[1] This research was sponsored by the SOA’s LTC Section, Social Insurance and Public Finance Section, and the SOA Research Institute.
[2] Edward Armentrout, “Long-Term Care Population Research Model,” Society of Actuaries, November 2024, https://www.soa.org/resources/research-reports/2024/ltc-population-research-model/.
[3] Agency for Healthcare Research and Quality, “Medical Expenditure Panel Survey Household Component,” AHRQ, Dec. 2, 2022, https://meps.ahrq.gov/survey_comp/household.jsp.
[4] Centers for Medicare and Medicaid Services, “Medicare Current Beneficiary Survey (MCBS),” CMS, Nov. 27, 2023, https://www.cms.gov/data-research/research/medicare-current-beneficiary-survey.
[5] University of Michigan Institute for Social Research, “Rand HRS Longitudinal File 2018 (V1),” Health and Retirement Study, Mar. 16, 2021, https://hrs.isr.umich.edu/news/data-announcements/rand-hrs-longitudinal-file-2018-v1.
[6] Centers for Disease Control and Prevention, “National Health Interview Survey” [archived content], CDC, Dec. 8, 2023, https://www.cdc.gov/nchs/nhis/1997-2018.htm.
[7] US Census Bureau, “Survey of Income and Program Participation (SIPP),” Census Bureau, Feb. 21, 2024, https://www.census.gov/programs-surveys/sipp.html.
[8] The Other category includes payments made by the US Department of Veterans Affairs, TRICARE, and other federal, state and local sources.