Sometimes Simple Does It
By Dave Ingram
Risk Management, April 2025

Sherlock Holmes once said, “Perhaps, when a man has special knowledge and special powers like my own, it rather encourages him to seek a complex explanation when a simpler one is at hand.” (in The Adventure of the Abbey Grange by Sir Arthur Conan Doyle). And while Doyle presents Holmes with many positive qualities, this is not one that we should plan to emulate.
In risk management, we are often tempted though. The risk models that many of us develop and sustain for insurers clearly fall into this category. The raw output from these models usually presents us with highly complicated and often complex stories of what is actually happening. But rather than follow Sherlock Holmes, we should be seeking to channel William of Occam. He championed the idea that a simpler explanation is often preferable, known today as Occam’s Razor.
It took many years and many experiences of audiences with glazed eyes after a presentation for me to realize how important this is for risk management communications.
Risk itself is a complex concept. Risk is not a tangible thing, the definition that I prefer is that risk is a possibility of an adverse outcome. (Many of my best friends prefer a two-sided definition of risk, equating it to volatility.) Managing risk is, therefore, a process of managing possibilities. Not an easy idea.
The idea of “risk tolerance” seems to have been invented by Holmes on one of those days when he was favoring complexity.
The NAIC ORSA Guidance Manual defines risk tolerance for insurers as, “The company’s qualitative and quantitative boundaries around risk-taking, consistent with its risk appetite. Qualitative risk tolerances are useful to describe the company’s preference for, or aversion to, particular types of risk, particularly for those risks that are difficult to measure. Quantitative risk tolerances are useful to set numerical limits for the amount of risk that a company is willing to take.”
Holmes, or your friendly neighborhood statistician, would likely state the risk tolerance as a maximum loss of $X at the 99th percentile. But, the standard question from a CFO then becomes, how do I choose the 99th percentile? And why should it be $X and not a million more or a million less? This sort of discussion is what makes risk tolerance seem to have a mystical quality.
Many smaller insurers look at that definition and decide to defer thinking about risk tolerance. But, Insurers that meet the NAIC requirement to provide an ORSA must come to terms with this.
And here is where thinking like William of Occam can be a major help. Risk tolerance does not have to be as complex as all of that. I once worked with a client who determined that their risk tolerance was an RBC Ratio of 300%*.[1] After several conversations about it, they decided to use the following picture to explain the concept to their board:
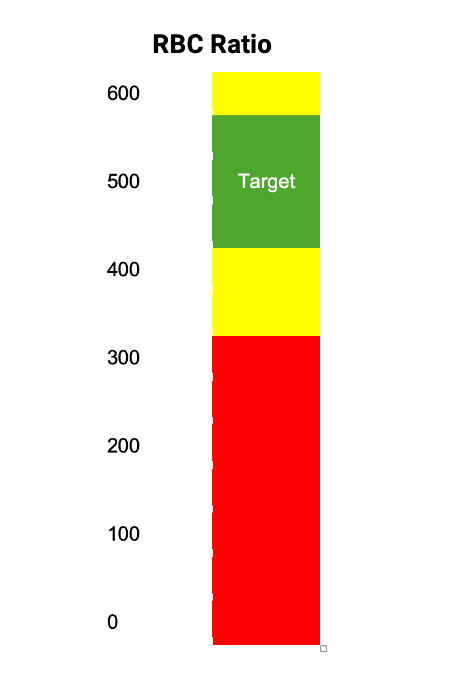
What they explained was that 500% RBC ratio was what they expected the RBC ratio to be under their plan, so they called that their “target.” The explanation of the colored bars was that as long as they stayed in the green area, they would consider themselves to be on plan and therefore would not discuss with the board throughout the year. The yellow bars represented situations where they would notify the board of the current events, present an explanation for why the RBC ratio had gone out of plan range and present management’s proposal for what, if anything, needed to be done to get back into the plan range. And the red area was when they were in violation of the risk tolerance, which would mean that management MUST make some significant response, which usually meant a major change to plans.
I attended the board meeting where they presented this. The board understood the concepts so completely that the board actually suggested a minor adjustment to the trigger point for board notification.
William of Occam would have loved that discussion!
I have since adapted that simple bar chart idea and use it as a tool to facilitate picking a risk tolerance. And that tool usually works. One key idea that I lifted from that simple bar chart is focusing first on the plan or target risk level. For simplicity, I will keep using the RBC ratio, but this approach can be used with any measure of risk.
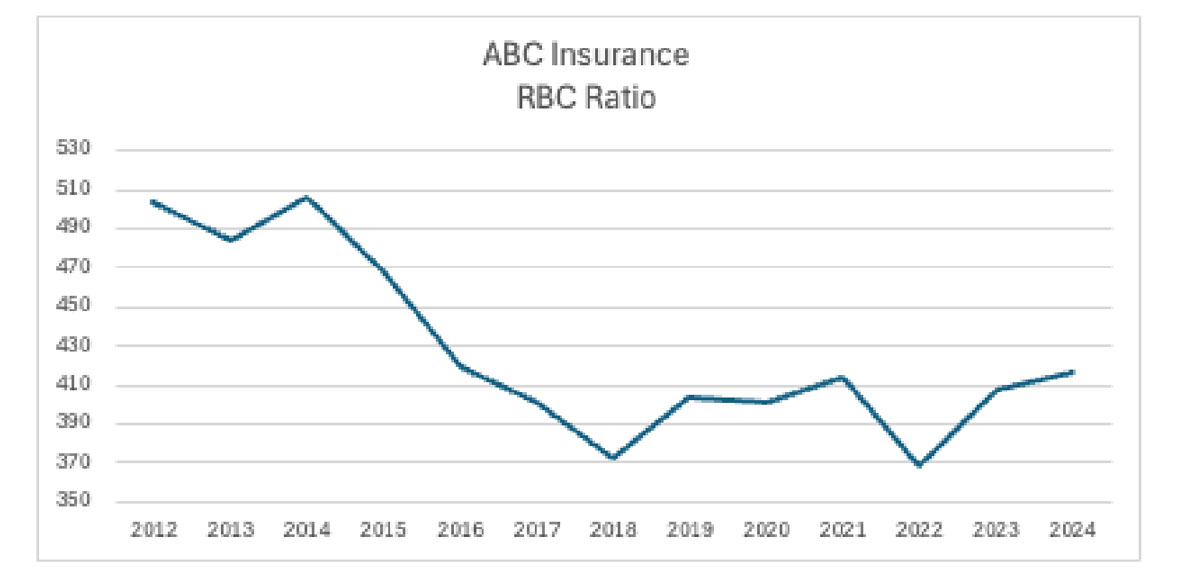
Step 1 of this process is to look back over an extended period of the company’s history at its actual RBC ratio history. (See Figure 1)
Figure 1
RBC Ratio
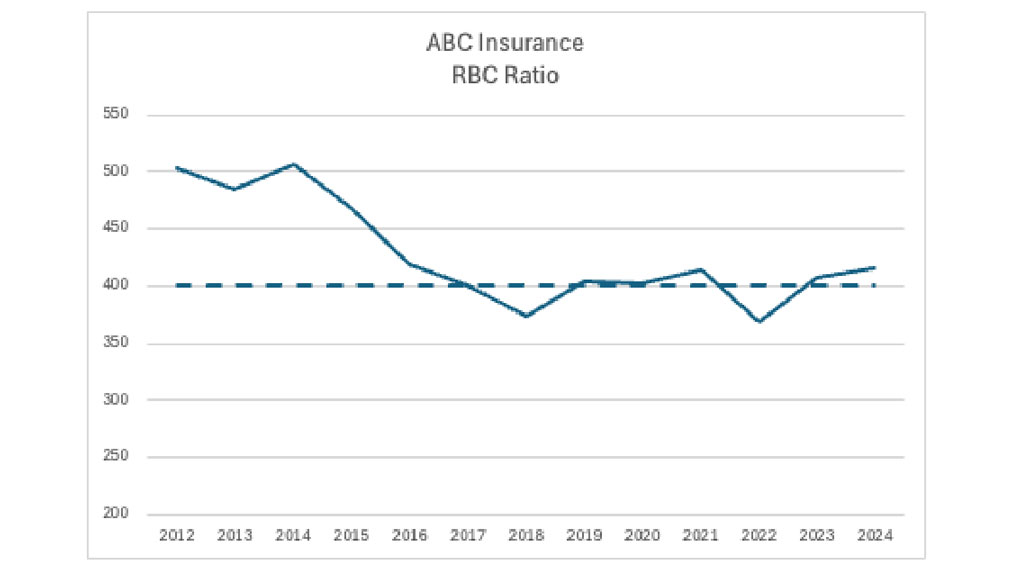
The second step is to me the most interesting and most effective step. In step 2, I look at Figure 1 and propose to the company what I see as the most likely level of RBC to represent their long-term target. In this case, I would have picked 410%, which they seemed to be close to in five of the last six years. The company usually has two reactions to my pick. First, they tell me that I got it wrong. In about 20 tries, I have never once made a pick that management agreed with. But, in deciding that my pick is wrong, in most cases, management is able to quickly come to a decision about what they want for their long-term target. Research has shown that having a common enemy brings groups, even groups of rivals, closer together. And while I am not an enemy in this situation, I am an outsider who is definitely unaware of exactly how management thinks of themselves. In this case, sometimes a management team will pick 400 as their target, so that, looking back, they beat that target five of six years or they might have it in their mind that the 2012–2014 levels are where they really want to get back to so they will set a stretch target of 430 or 450. In this case, management settled on 400% (See Figure 2)
Figure 2
RBC Ratio with Target
The next step is for me to work off of the target to apply the color bands indicating the green, yellow and red zones. (See Figure 3)
Figure 3
RBC Ratio with Target and Tolerances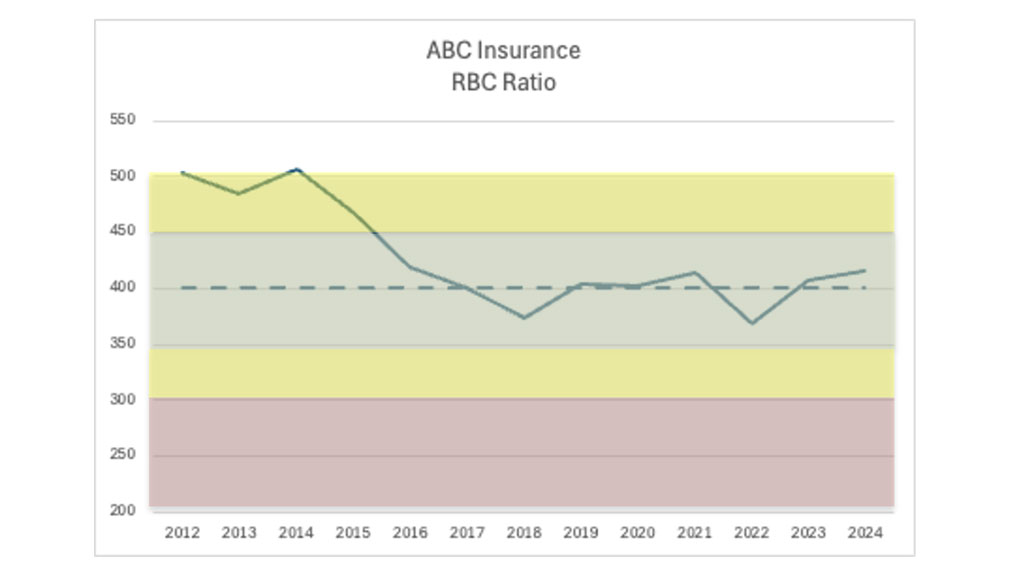
So, we construct this entire picture talking about the green target zone, the yellow alert zone and the red action zone. We do not actually mention risk tolerance.
But, in fact, we have constructed the start of a risk tolerance statement here. I have used these graphs with an ORSA report to show how a company holds up in a stress scenario.
This illustration was all done with the RBC Ratio. There are other options that are simpler and others that are more complicated.
Simple Metrics
- One-Factor Risk-Ratios: For life companies, a ratio of surplus to assets can be used. For health and property casualty (P&C), the ratio of surplus to premiums is used. P&C insurers have historically used premium-to-surplus ratios, but I like a ratio where a higher number is better.
- Total Risk Ratio: For P&C insurers, some companies have used surplus divided by premiums plus reserves to capture both underwriting risk and reserve risk. That ratio comes close to admitting that P&C insurers have investment risk as well.
More complicated Metrics
- Rating Agency Capital Formulas: Usually adjusted for the company’s target rating level.
- Own Factor Formulas: Calculated just like the RBC or rating agency capital formula, but with factors that have been developed to reflect the company specific risk levels for each category.
- Stress Tests: A version of the own factor formula where the factors are determined from stress tests.
- Stochastic Capital Models: The gold standard for aggregate risk analysis. These can be used directly or they can feed an own factor approach by using the stochastic model to calculate the factors. The own factors can be used to estimate interim risk capital levels.
Risk Tolerance for a New Insurer
The above approach doesn’t work for a start-up company that wants to come out of the box managing their risk and capital together. There are two fairly straightforward methods that are open to new insurers.
Peer Comparison: Using public data to assess and rank peers with regard to their surplus to risk ratios, a new insurer can decide where they want to be in the standings and that becomes their risk tolerance. This is subject to the limitations of assessing risk using only public data.
Rating Target: This means setting a target for their capital-to-risk ratio as defined by a rating agency formula. Many companies include this as a part of their risk tolerance.
You probably already have a risk tolerance at your company. Perhaps someone went through an exercise like the above a decade or more ago. Or maybe they somehow got management and the board to sign off on a tolerance framed in terms of probabilities.
But someday, it will be the time to re-evaluate the risk tolerance, and it will be likely that some or all of the management team who signed off on the last risk tolerance will not be a part of that discussion. And if that is the case, I urge you to consider Simple. Sometimes Simple Does It.
Statements of fact and opinions expressed herein are those of the individual authors and are not necessarily those of the Society of Actuaries, the newsletter editors, or the respective authors’ employers.
Dave Ingram is a part-time consultant at Actuarial Risk Management where he co- authors the Crossing Thin Ice newsletter and podcast series. He is also one of the founders of the Joint Risk Management Section and a current member of the SOA Board. Dave can be contacted at daveingram@optonline.net.