GAAP Sources of Earnings—Decoding Decrement Effects for Traditional Products
The Financial Reporter, March 2025
By Nate Worrell

How did mortality experience affect this quarter’s earnings? On the surface this seems like a straightforward question. And I recall that at one point in a valuation close meeting, an actuary provided a straightforward answer for unfavorable earnings—“more people died.”
Two elements are baked into this type of analysis. First is the composition of earnings. In the case of mortality events, earnings are influenced by cash outlays (death benefits), AND a corresponding reserve release. Second is an implicit question about what is happening: Does this align with our expectations?
These kinds of storylines and inquiries aren’t new. In the FAS 60 world, we could drill into these types of analysis on a contract-by-contract basis. By assembling policy-level results, we could build a narrative about a block of business and call it a month.[1]
But, things have changed.
The new financial framework for GAAP reporting introduces “improvements” that may obfuscate the earnings picture. Let’s provide a quick introduction and then dive deeper into each one.
- Aggregation (Cohorts)—We no longer have a policy-by-policy view of the liability.
- Fluctuation (Dynamic Reserving)—Reserves update at each valuation point, which is a departure from being set at issue and only unlocked under certain circumstances.
- Limitation (Caps/Floors)—The full picture of a result is masked by formulaic limits.
Aggregation
Grouping insurance policies into cohorts isn’t a new concept for insurance companies. Both FAS 97 and FAS 120 involved cohorts. Under these frameworks, explaining earnings involved explaining movement in key building blocks (i.e., change in assessments).
This is an approach we can take under long duration targeted improvements (LDTI). While we may not have a true liability at the policy level, we do have insight into its underlying cash flows and their actuarial present values (PV). If we can illuminate the ingredients, hopefully we can start to develop an overall earnings story.
The goal is to break down movements in release of the present value of benefits and expenses, and the release of the PV of premiums. For each policy in the valuation extract at period start, we need the projected amount of the (PV) if they survived to period end. If that policy dies, we know how much PV will go away.
While we are looking at PV, we can also grab the projected benefits paid in the period as the basis for our expected viewpoint.
Premiums are a little more convoluted than benefits and expenses. To understand why, we need to explore our next layer of obscurity.
Fluctuation
GAAP earnings have long had the goal to make earnings level over the contract lifetime. The leveraging factor is the net premium ratio, also called the K-factor, and is applied to the gross premiums. Formulaically: Liability for Future Benefits = PV Benefits – K x PV Premiums.
Under the FAS 60 regime, this value was locked in at issue. After LDTI, it can change at every valuation point.
Given this extra dimension, the actuary must take a page out of physics. Just as light can be a particle or a wave, understanding earnings with respect to premium requires us to ignore one thing in order to understand another.
We will evaluate this in terms of basis changes and activity.
In the standard roll-forward analysis, there are several measurement points: Period start, assumption updates, experience updates, period end (and perhaps new business and reinsurance). Each step in the roll-forward can be considered a basis change and tells us the impact of each new measurement, after all activity has been considered.
Activity focuses on decrements, keeping the basis fixed.
An expanded roll-forward analysis may then take the following form:
- Update of assumptions (basis)—required in roll-forward
- Impact of deaths (activity)
- Impact of lapse (activity)
- Update of experience (basis)—required in roll-forward
Choosing the reference point as a basis for activity analysis is important because it allows us to define an expectation to compare to actuals.
Before diving into this analysis, it is necessary to also consider the effect of limitations.
Limitations
There are two control mechanisms in the GAAP standards that will affect the final results.
- Capping the net premium ratio at 100%, and
- flooring the reserve at zero.
Viewing results on an uncapped and unfloored basis will allow us to quantify the effect of these influences on the business. This may be particularly helpful when a business crosses over from profitable to unprofitable. It may also help quantify how much of an impact is spread through the K-factor versus taken directly. And, if a business has a negative reserve that is trending toward a positive one, an unrestricted point of view can give insight into potential future changes in the liability.
There is a practical consideration to all of this, as each piece of information may require more model runs and certainly more model output. The management of this data and added procedures will require prudence and diligence.
Putting Humpty Dumpty Back Together Again
We now have a lot of pieces of our story, but how does it all tie together?
To recap:
- We need the ingredients of the liability at the policy level: PV benefits, PV expenses, PV gross policy premiums. We also need actual and expected deaths, lapses, incidence and other decrements.
- We need to set a basis. A common one may be to develop the PVs using the current “Best Estimate” assumptions. If we do this, it will be important to disclose the impact of the assumption update as an isolated step before detailing decrements.
- Using the basis, we need to borrow the K-factor from the cohort, keeping in mind potential limitations:
- If the cohort is capped at 100% net premium ratio, obtaining an uncapped K-factor may be required.
Referencing sources of profit statements,[2] that derive earnings analysis from recursive reserve formulations, we will use the ingredients at our disposal in a comparable manner, modifying as we go for new considerations.
We will start with our beginning margin, in this case after assumption updates defined as:
Premium x (1-Net Premium Ratio)
The mortality gain/loss per policy becomes:
(Actual - Expected Deaths) x PV Benefits & Expenses
- (Actual – Expected Deaths) x PV Premium x Net Premium Ratio
+ (Actual – Expected Death Benefits Paid)
Here, we can also see how the mortality is split between current period cash and change in liability (via PVs). This may also be presented as actual “cost” and expected “cost” as opposed to the (A-E) for each component.
We can repeat this same exercise for other decrements: Lapse, incidence, etc. Then, we would sum up the policies to get the cohort-level impact.
However, after this, our work is not done. This is the new world of GAAP after all. After including all experience, we need another basis change. This is the impact of including actual experience into the net premium ratio calculations (k’).
Impact of Experience: (PV Premium*k – PV Premium*k’)
And if applicable, the impact of capping the K-factor could be isolated as its own step.
This then allows us to get back to a total liability decomposition.
Total Sources of Income = Margin at Start + Mortality Gain/Loss + Lapse Gain/Loss + Other Decrements Gain/Loss + Impact of Experience + Impact of Capping + Impact of Flooring
The last three terms (experience “fluctuation,” caps “limitation,” and floors “limitation”) are new elements to the source of earnings (SOE) analysis in a post-FAS 60 world.
Let’s take a look at a sample exhibit to highlight these concepts.
Sample Exhibit
The starting margin is determined after the impact of assumption updates.
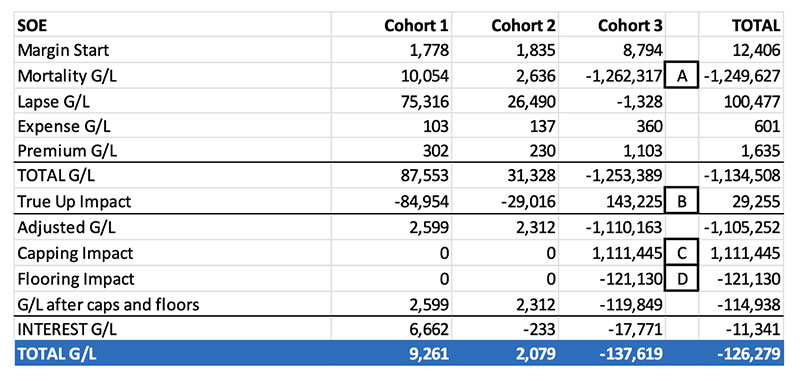
Table 1 below highlights that a loss in the current period is driven by mortality experience in Cohort 3 (A) partially offset by the true-up of the K-factor (B), and influences of floors (C) and caps (D). Cohorts 1 and 2 show gains from lapsation activities.
Table 1
Illustrative SOE
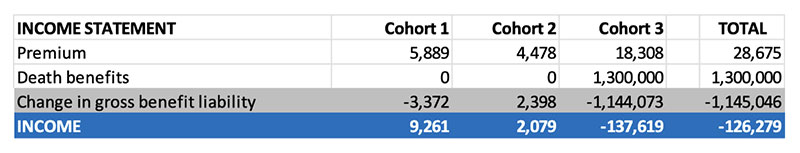
Looking at a simplified income statement, we see that “Total G/L” reconciles with total income. (See Table 2)
Table 2
Illustrative Income Statement
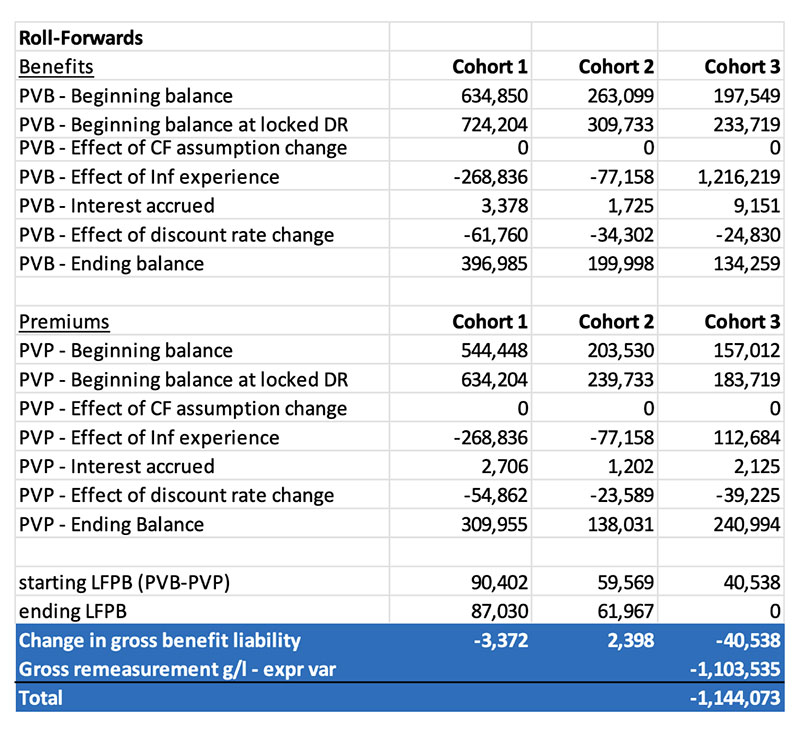
And for further reference, here is the standard roll-forward disclosure and change in liability for future benefits. (See Table 3)
Table 3
Illustrative Roll Forward
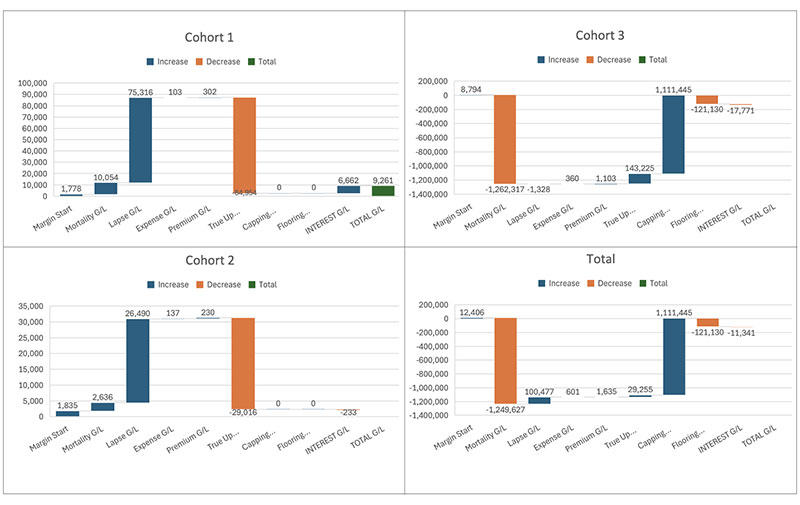
The SOE can also be presented as a waterfall chart. Note how the true-up of experience into the net premium ratio acts to depress gains on cohorts 1 and 2, and offsets losses in cohort 3. (See Figure 1)
Figure 1
Illustrative Waterfall Charts by Cohort
Closing Thoughts
Interest Impacts: Historically evaluated as actual less expected earned rates, this component now also would include locked-in rate versus current rate as disclosed through OCI.
Business Groupings: While the accounting standard requires certain contract types to be organized into issue year cohorts, for the sake of business management, there may be a need to collate groups of contracts into other partitions, sometimes called subcohorts. It can be up to the actuary how to value the subcohorts: Treat as if they were their own cohort or allocate the cohort net premium ratio to each subcohort. Therefore, decisions about the basis for experience analysis may use the cohort level k-factor or the subcohort k-factor.
Reinsurance: It may be worth performing a separate analysis at the reinsurance treaty level.
DAC: As a retrospective calculation, decrement-oriented movements would not impact income due to changes in amortization in the current period. However, it may be useful to detail how changes in in-force composition contribute to a change in the amortization base for the next period’s calculation.
Non-deferred expense not in LFBP: Developing actual and expected analysis on this line item may be worthwhile; however, since there is not a reserve for this amount, only the cash outlay is considered.
Other Cash Flows: Non-actuarial based activity may influence earnings. If more premium is collected due to advance payment, or if a pending rate increase gets approved, having a mechanism to capture miscellaneous impacts can be helpful.
New Business: There may be a separate impact of new business issuance highlighted in the source of earnings analysis. This could also include the impact of new deferrals to DAC balances.
Health—Disability and Long-Term Care: These lines of business present other challenges, including movement between active and on claim status and everything in between. Under new GAAP, all liabilities are considered holistically, so there may be some noise in trying to tease out the impacts of incidence and recovery experience. Furthermore, other types of assumptions may require extra analysis, including utilization assumptions, rate increase effectiveness, and more. Lastly, the treatment of claim liabilities like IBNR, ICOS, LAE, etc., may have their own standalone analysis that may be done apart from the generic LFPB decomposition.
Statements of fact and opinions expressed herein are those of the individual authors and are not necessarily those of the Society of Actuaries, the newsletter editors, or the respective authors’ employers.
Nate Worrell, FSA, is a director of customer success at Moody’s. He can be reached at nathan.worrell@moodys.com.
Endnotes
[1] Sources of Profit Statement. 1996 Valuation Symposium Proceeding Session 8. Society of Actuaries. Kenneth A. Klinger, David A. Ricci, Yiji S. Start. Sources of Profit Statements
[2] https://www.soa.org/49380c/globalassets/assets/library/proceedings/valuation-actuary-symposium-proceedings/1985-99/1996/january/vasp965.pdf